IBKR contracts
2,699
validated candidates
This dashboard replaces illustrative market content with the current state of our read-only Nasdaq equity data archive and the controls used to keep future backtests honest.
Session: 2026-09-01 · USD
| Symbol | Close | Volume | Approx. dollar volume |
|---|---|---|---|
| MU | $933.44 | 484,263 | $452.0M |
| AAPL | $325.13 | 913,199 | $296.9M |
| SNDK | $1,536.87 | 177,333 | $272.5M |
| TSLA | $356.09 | 651,196 | $231.9M |
| META | $578.54 | 232,980 | $134.8M |
| NVDA | $217.44 | 614,943 | $133.7M |
| MSFT | $501.02 | 249,785 | $125.1M |
| KLAC | $170.89 | 612,705 | $104.7M |
| ASML | $1,665.14 | 60,827 | $101.3M |
| AVGO | $369.68 | 268,458 | $99.2M |
Win rate was 38.65% before costs and 36.24% after the illustrative 10-bps-per-side cost. Mean trade return was −1.094% before costs and −1.292% after costs. Maximum drawdown was approximately −99.84% before costs. This is not a recommendation or a prediction.
At the completed signal-day close, a symbol must pass all declared guards. Candidates are ranked by relative volume, never by a hindsight-selected score.
The original baseline is a research benchmark: enter at the signal-day close and exit at each symbol’s next observed regular-session open. Costs and realistic fills are separate experiments.
Invalid, non-finite, zero-volume, and impossible OHLC observations are rejected. Bad observations break consecutive-session requirements rather than being bridged over.
This archive uses a current Nasdaq directory and has not yet established point-in-time membership or symbol-level fractional eligibility. It is a research dataset, not a performance guarantee or trade recommendation.
Hourly collection is prioritized by research relevance: recent dollar liquidity, market capitalization, data completeness and historical appearance in the baseline signal. The pilot passed with 1,050 bars and zero errors. Full-universe collection remains paused until chunking, timezone validation and resumable checkpoints pass.
Top next candidates: GOOGL, NVDA, AVGO, GOOG, KLAC. Data is local to the research workstation; this page shows only an aggregate summary.
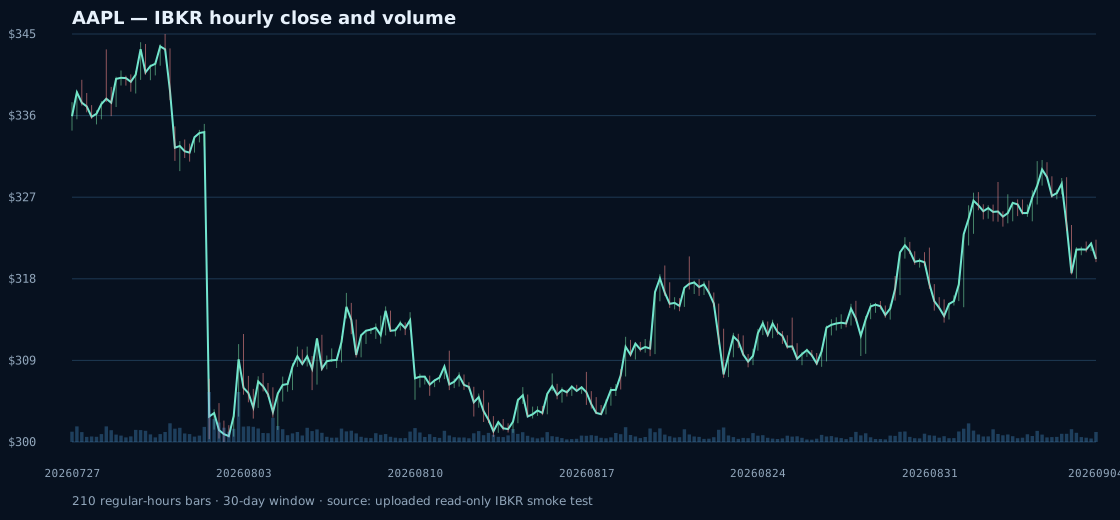
AAPL chart generated from the uploaded five-symbol IBKR smoke-test CSV. It shows hourly close structure with intrabar range markers and volume bars. This is a visualization of collected data, not a trading recommendation.